
Telecom Churn Analysis using Python
In this project, I harnessed a telecom dataset to craft insightful visualizations and generate meaningful insights, leveraging the power of Python libraries such as Pandas, Seaborn, and Matplotlib to effectively analyze and communicate complex telecommunications data.
Store Sales Data Analysis Using Excel
I utilized Excel to meticulously analyze store sales data, creating an exceptional dashboard with pivot tables, charts, filters, and advanced formulas. The result offers a comprehensive and visually engaging overview, facilitating informed decision-making for strategic business optimization.
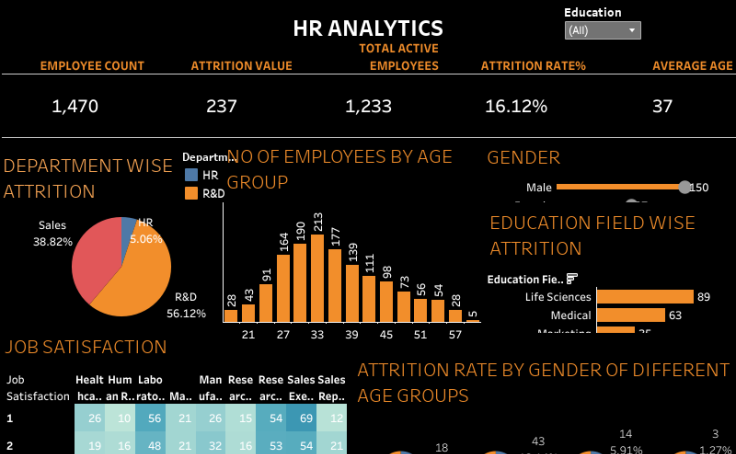
HR Data Analysis Using Tableau
I designed a Tableau dashboard featuring valuable insights derived from HR data, effectively conveying meaningful information through a variety of charts for a comprehensive understanding of human resources trends and analytics.

Exploring Covid-19 Dataset using SQL
I employed SQL queries on Google BigQuery to extract valuable insights from the COVID-19 dataset, enabling a thorough analysis of pandemic-related data and contributing to a comprehensive understanding of the global health landscape.

Heart Disease Analysis using ML Algorithms
I analyzed heart disease data using Python libraries (Pandas, NumPy, Seaborn and skicit-learn) and applied diverse machine learning models (SVM, KNN, NB, RF, LR) to extract valuable insights, deepening our understanding of factors influencing heart disease.

Web Scraping the list of Largest Companies in India
I implemented web scraping on the Wikipedia website to gather information on the list of largest companies in India. Utilizing Python libraries such as Beautiful Soup and Requests, I efficiently extracted and organized the data.